Global Carbon Budget 2020
A newer version of this dataset is available. The latest version available on Openclimatedata is 2024.
Published: December 11, 2020
Citation: Friedlingstein et al., Global Carbon Budget 2020. https://doi.org/10.5194/essd-12-3269-2020
Data: Global Carbon Project. (2020). Supplemental data of Global Carbon Budget 2020 (Version 1.0) [Data set]. Global Carbon Project. https://doi.org/10.18160/gcp-2020
Changelog:
- 2019 total anthropogenic CO₂ emissions: 11.5 ± 0.9 GtC/year (42.2 ± 3.3 GtCO₂/year).
- 2019 growth in fossil CO₂ was only about 0.1 % with fossil emissions increasing to 9.9 ± 0.5 GtC/year excluding the cement carbonation sink (9.7 ± 0.5 GtC/year when cement carbonation sink is included)
- 2019 global atmospheric CO₂ concentration: 409.85 ± 0.1 ppm
- inclusion of cement carbonation sink in budget calculations
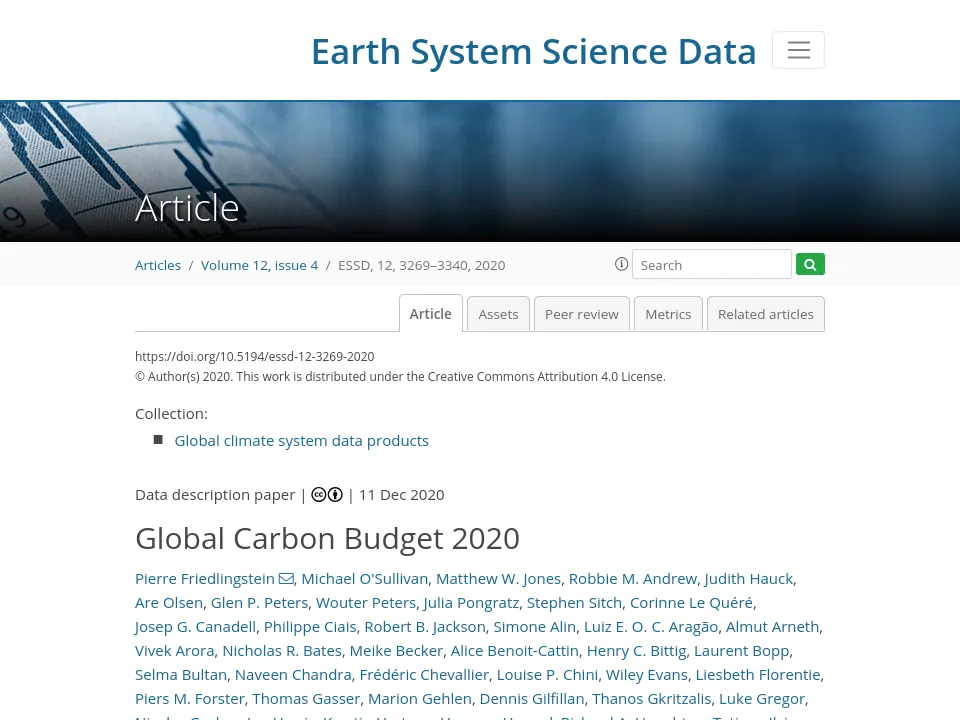

Fossil fuel and cement production emissions by fuel type
All values in million tonnes of carbon per year (MtC/yr), except the per capita emissions which
are in tonnes of carbon per person per year (tC/person/yr). For values in million tonnes of CO₂
per year, multiply the values below by 3.664
1MtC = 1 million tonne of carbon = 3.664 million tonnes of CO₂
1MtC = 1 million tonne of carbon = 3.664 million tonnes of CO₂
Methods: Full details of the method are described in Friedlingstein et al (2020).
The uncertainty for the global estimates is about ±5 % for a ± 1 sigma confidence level.
Cite as: Friedlingstein et al (2020; see summary tab)
The uncertainty for the global estimates is about ±5 % for a ± 1 sigma confidence level.
Cite as: Friedlingstein et al (2020; see summary tab)
fossil emissions excluding carbonation
1960
1980
2000
0
2000
4000
6000
8000
MtC
Coal
1960
1980
2000
0
1000
2000
3000
4000
MtC
Oil
1960
1980
2000
0
1000
2000
3000
MtC
Gas
1960
1980
2000
0
500
1000
1500
2000
MtC
Cement emission
1960
1980
2000
0
100
200
300
400
MtC
Flaring
1960
1980
2000
0
20
40
60
80
100
MtC
Other
1960
1980
2000
0
10
20
30
40
MtC
Per Capita
1960
1980
2000
0
0.5
1
MtC
Unit MtC/year, tC/person/year
| Year | fossil emissions excluding carbonation | Coal | Oil | Gas | Cement emission | Flaring | Other | Per Capita |
|---|---|---|---|---|---|---|---|---|
| 1959 | 2415.0000 | 1349.0000 | 794.0000 | 207.0000 | 40.0000 | 25.0000 | 0 | 0.8100 |
| 1960 | 2548.0000 | 1400.0000 | 852.0000 | 228.0000 | 43.0000 | 24.0000 | 0 | 0.8400 |
| 1961 | 2553.0000 | 1342.0000 | 902.0000 | 241.0000 | 45.0000 | 24.0000 | 0 | 0.8300 |
| 1962 | 2644.0000 | 1338.0000 | 970.0000 | 264.0000 | 48.0000 | 23.0000 | 0 | 0.8400 |
| 1963 | 2794.0000 | 1392.0000 | 1039.0000 | 286.0000 | 51.0000 | 25.0000 | 0 | 0.8700 |
| 1964 | 2939.0000 | 1418.0000 | 1119.0000 | 315.0000 | 56.0000 | 31.0000 | 0 | 0.9000 |
| 1965 | 3076.0000 | 1441.0000 | 1204.0000 | 337.0000 | 59.0000 | 36.0000 | 0 | 0.9200 |
| 1966 | 3219.0000 | 1454.0000 | 1296.0000 | 366.0000 | 63.0000 | 39.0000 | 0 | 0.9400 |
| 1967 | 3322.0000 | 1431.0000 | 1382.0000 | 392.0000 | 65.0000 | 52.0000 | 0 | 0.9500 |
| 1968 | 3503.0000 | 1447.0000 | 1505.0000 | 427.0000 | 70.0000 | 56.0000 | 0 | 0.9900 |
| 1969 | 3737.0000 | 1502.0000 | 1628.0000 | 467.0000 | 73.0000 | 67.0000 | 0 | 1.0300 |
| 1970 | 4047.0000 | 1550.0000 | 1854.0000 | 490.0000 | 77.0000 | 76.0000 | 0 | 1.0900 |
| 1971 | 4210.0000 | 1551.0000 | 1961.0000 | 529.0000 | 82.0000 | 88.0000 | 0 | 1.1200 |
| 1972 | 4406.0000 | 1549.0000 | 2115.0000 | 561.0000 | 87.0000 | 95.0000 | 0 | 1.1400 |
| 1973 | 4640.0000 | 1593.0000 | 2262.0000 | 583.0000 | 92.0000 | 110.0000 | 0 | 1.1800 |
| 1974 | 4620.0000 | 1596.0000 | 2230.0000 | 595.0000 | 92.0000 | 107.0000 | 0 | 1.1500 |
| 1975 | 4613.0000 | 1631.0000 | 2201.0000 | 599.0000 | 91.0000 | 92.0000 | 0 | 1.1300 |
| 1976 | 4858.0000 | 1704.0000 | 2315.0000 | 634.0000 | 97.0000 | 108.0000 | 0 | 1.1700 |
| 1977 | 4991.0000 | 1740.0000 | 2400.0000 | 646.0000 | 102.0000 | 104.0000 | 0 | 1.1800 |
| 1978 | 5174.0000 | 1793.0000 | 2488.0000 | 680.0000 | 108.0000 | 106.0000 | 0 | 1.2000 |
| 1979 | 5312.0000 | 1860.0000 | 2526.0000 | 718.0000 | 110.0000 | 98.0000 | 0 | 1.2100 |
| 1980 | 5286.0000 | 1915.0000 | 2435.0000 | 739.0000 | 110.0000 | 86.0000 | 0 | 1.1900 |
| 1981 | 5142.0000 | 1903.0000 | 2316.0000 | 748.0000 | 110.0000 | 65.0000 | 0 | 1.1300 |
| 1982 | 5104.0000 | 1938.0000 | 2261.0000 | 732.0000 | 110.0000 | 64.0000 | 0 | 1.1100 |
| 1983 | 5152.0000 | 1996.0000 | 2242.0000 | 744.0000 | 112.0000 | 58.0000 | 0 | 1.1000 |
| 1984 | 5302.0000 | 2081.0000 | 2253.0000 | 803.0000 | 114.0000 | 51.0000 | 0 | 1.1100 |
| 1985 | 5490.0000 | 2232.0000 | 2257.0000 | 836.0000 | 115.0000 | 50.0000 | 0 | 1.1300 |
| 1986 | 5568.0000 | 2257.0000 | 2325.0000 | 820.0000 | 120.0000 | 46.0000 | 0 | 1.1200 |
| 1987 | 5749.0000 | 2338.0000 | 2352.0000 | 889.0000 | 125.0000 | 45.0000 | 0 | 1.1400 |
| 1988 | 5968.0000 | 2418.0000 | 2435.0000 | 932.0000 | 133.0000 | 51.0000 | 0 | 1.1600 |
| 1989 | 6057.0000 | 2424.0000 | 2475.0000 | 981.0000 | 136.0000 | 41.0000 | 0 | 1.1600 |
| 1990 | 6195.0000 | 2380.0000 | 2516.0000 | 1054.0000 | 136.0000 | 68.0000 | 41.0000 | 1.1600 |
| 1991 | 6324.0000 | 2358.0000 | 2641.0000 | 1075.0000 | 140.0000 | 72.0000 | 38.0000 | 1.1700 |
| 1992 | 6126.0000 | 2299.0000 | 2500.0000 | 1083.0000 | 146.0000 | 63.0000 | 35.0000 | 1.1100 |
| 1993 | 6191.0000 | 2326.0000 | 2507.0000 | 1112.0000 | 152.0000 | 62.0000 | 32.0000 | 1.1100 |
| 1994 | 6235.0000 | 2340.0000 | 2517.0000 | 1122.0000 | 162.0000 | 63.0000 | 31.0000 | 1.1000 |
| 1995 | 6368.0000 | 2408.0000 | 2542.0000 | 1152.0000 | 171.0000 | 63.0000 | 32.0000 | 1.1100 |
| 1996 | 6564.0000 | 2466.0000 | 2626.0000 | 1203.0000 | 174.0000 | 64.0000 | 31.0000 | 1.1300 |
| 1997 | 6602.0000 | 2453.0000 | 2667.0000 | 1207.0000 | 180.0000 | 65.0000 | 31.0000 | 1.1200 |
| 1998 | 6581.0000 | 2388.0000 | 2694.0000 | 1227.0000 | 179.0000 | 62.0000 | 31.0000 | 1.1000 |
| 1999 | 6668.0000 | 2369.0000 | 2758.0000 | 1263.0000 | 187.0000 | 60.0000 | 31.0000 | 1.1000 |
| 2000 | 6856.0000 | 2456.0000 | 2806.0000 | 1295.0000 | 195.0000 | 72.0000 | 31.0000 | 1.1200 |
| 2001 | 6914.0000 | 2470.0000 | 2830.0000 | 1308.0000 | 204.0000 | 73.0000 | 30.0000 | 1.1100 |
| 2002 | 7072.0000 | 2576.0000 | 2827.0000 | 1347.0000 | 215.0000 | 76.0000 | 31.0000 | 1.1200 |
| 2003 | 7417.0000 | 2787.0000 | 2899.0000 | 1394.0000 | 231.0000 | 76.0000 | 31.0000 | 1.1600 |
| 2004 | 7770.0000 | 2969.0000 | 3000.0000 | 1439.0000 | 247.0000 | 82.0000 | 33.0000 | 1.2000 |
| 2005 | 8027.0000 | 3149.0000 | 3022.0000 | 1474.0000 | 261.0000 | 88.0000 | 34.0000 | 1.2300 |
| 2006 | 8290.0000 | 3328.0000 | 3046.0000 | 1508.0000 | 285.0000 | 88.0000 | 35.0000 | 1.2500 |
| 2007 | 8541.0000 | 3487.0000 | 3063.0000 | 1559.0000 | 306.0000 | 92.0000 | 35.0000 | 1.2700 |
| 2008 | 8719.0000 | 3619.0000 | 3057.0000 | 1603.0000 | 310.0000 | 96.0000 | 34.0000 | 1.2800 |
| 2009 | 8587.0000 | 3574.0000 | 2999.0000 | 1573.0000 | 319.0000 | 94.0000 | 28.0000 | 1.2500 |
| 2010 | 9043.0000 | 3802.0000 | 3081.0000 | 1694.0000 | 339.0000 | 96.0000 | 31.0000 | 1.3000 |
| 2011 | 9337.0000 | 4025.0000 | 3083.0000 | 1739.0000 | 364.0000 | 94.0000 | 32.0000 | 1.3300 |
| 2012 | 9487.0000 | 4067.0000 | 3145.0000 | 1773.0000 | 374.0000 | 95.0000 | 32.0000 | 1.3300 |
| 2013 | 9549.0000 | 4072.0000 | 3174.0000 | 1785.0000 | 390.0000 | 95.0000 | 33.0000 | 1.3200 |
| 2014 | 9619.0000 | 4079.0000 | 3205.0000 | 1799.0000 | 405.0000 | 98.0000 | 33.0000 | 1.3200 |
| 2015 | 9610.0000 | 3991.0000 | 3252.0000 | 1846.0000 | 390.0000 | 99.0000 | 32.0000 | 1.3000 |
| 2016 | 9613.0000 | 3920.0000 | 3267.0000 | 1894.0000 | 399.0000 | 101.0000 | 31.0000 | 1.2900 |
| 2017 | 9742.0000 | 3934.0000 | 3323.0000 | 1942.0000 | 403.0000 | 110.0000 | 31.0000 | 1.2900 |
| 2018 | 9940.0000 | 3990.0000 | 3344.0000 | 2044.0000 | 413.0000 | 117.0000 | 31.0000 | 1.3000 |
| 2019 | 9945.6222 | 3919.9120 | 3371.7552 | 2078.5245 | 426.7905 | 117.2204 | 31.4195 | 1.2894 |
Download CSV: global-carbon-budget-2020-fossil-emissions.csv