Global Carbon Budget
The annually published Global Carbon Budget is a collaborative effort of the global carbon cycle science community coordinated by the Global Carbon Project. Since 2019 the Global Carbon Budget Office is led by Pierre Friedlingstein from the University of Exeter’s Global Systems Institute with the support of more than 100 people from 70 organisations in 18 countries.
Openclimatedata provides visualisations and overview of the data, as well as CSV versions of the Excel files.
Releases of the Global Carbon Budget
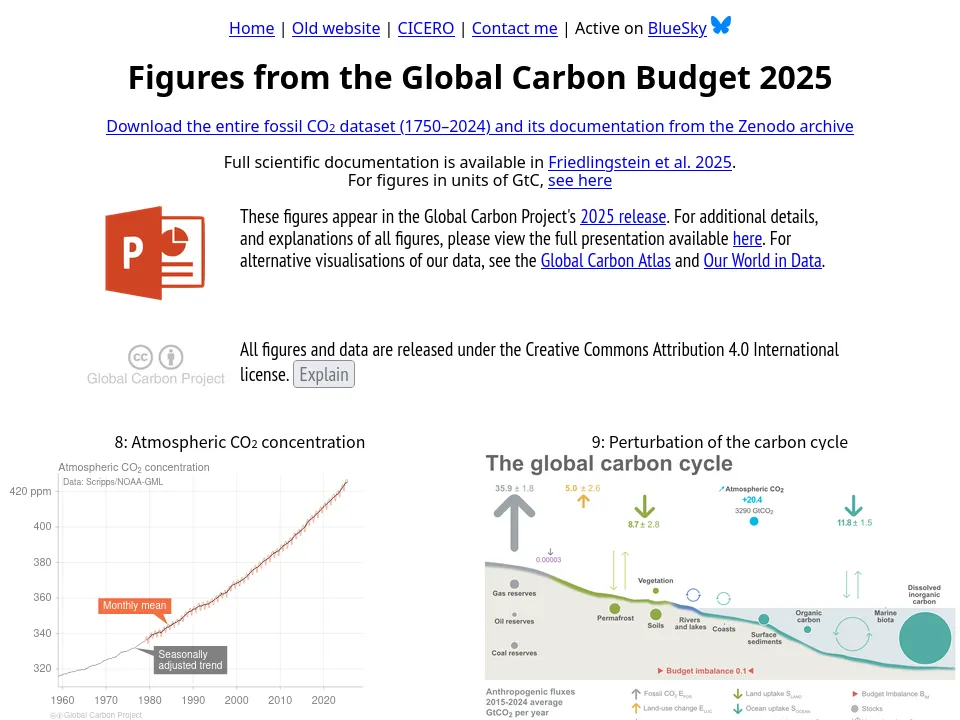
Global Carbon Budget 2025
LatestPublished: May 13, 2026
Citation: Friedlingstein et al., Global Carbon Budget 2025. https://doi.org/10.5194/essd-18-3211-2026
Data: Global Carbon Project. (2025). Supplemental data of Global Carbon Budget 2025 (Version 1.0) [Data set]. Global Carbon Project. https://doi.org/10.18160/gcp-2025
- total anthropogenic CO₂ emissions of 11.6 ± 0.9 GtC/year (42.4 ± 3.2 GtCO₂/year)
- 2024 fossil emissions increased by 1.1% relative to 2023 to 10.3 ± 0.5 GtC/year (including the cement carbonation sink, 0.2 GtC/year)
- 2024 global atmospheric CO₂ concentration: 422.8 ± 0.1 ppm
- remaining carbon budget for a 50 % likelihood to limit global warming to 1.5, 1.7, and 2 °C has been reduced to 50 GtC (170 GtCO₂), 145 GtC (525 GtCO₂) and 290 GtC (1055 GtCO₂)

Published: March 14, 2025
Citation: Friedlingstein et al., Global Carbon Budget 2024. https://doi.org/10.5194/essd-17-965-2025
Data: Global Carbon Project. (2024). Supplemental data of Global Carbon Budget 2024 (Version 1.0) [Data set]. Global Carbon Project. https://doi.org/10.18160/gcp-2024
- 2023 total anthropogenic CO₂ emission (including the cement carbonation sink) of 11.1 ± 0.9 GtC/year (40.6 ± 3.2 GtCO₂/year)
- 2023 fossil CO₂ emissions increased by 1.3% relative to 2022 to 10.1 ± 0.5 GtC/year (including the cement carbonation sink, 0.2 GtC/year)
- 2023 global atmospheric CO₂ concentration: 419.3 ± 0.1 ppm
- remaining carbon budget for a 50 % likelihood to limit global warming to 1.5, 1.7, and 2 °C has been reduced to 65 GtC (235 GtCO₂), 160 GtC (585 GtCO₂), and 305 GtC (1110 GtCO₂)

Published: December 5, 2023
Citation: Friedlingstein et al., Global Carbon Budget 2023. https://doi.org/10.5194/essd-15-5301-2023
Data: Global Carbon Project. (2023). Supplemental data of Global Carbon Budget 2023 (Version 1.1) [Data set]. Global Carbon Project. https://doi.org/10.18160/gcp-2023
- 2022 total anthropogenic CO₂ emissions (including the cement carbonation sink): 11.1±0.8 GtC/year (40.7±3.2 GtCO₂/year).
- 2022 fossil CO₂ emissions increased by 0.9% to 9.9 ± 0.5 GtC/year (including the cement carbonation sink, 0.2 GtC/year)
- 2022 global atmospheric CO₂ concentration: 417.1 ± 0.1 ppm
- remaining carbon budget for a 50% likelihood to limit global warming to 1.5, 1.7, and 2°C has been reduced to 75 GtC (275 GtCO₂), 175 GtC (625 GtCO₂), and 315 GtC (1150 GtCO₂)
Published: November 11, 2022
Citation: Friedlingstein et al., Global Carbon Budget 2022. https://doi.org/10.5194/essd-14-4811-2022
Data: Global Carbon Project. (2022). Supplemental data of Global Carbon Budget 2022 (Version 1.0) [Data set]. Global Carbon Project. https://doi.org/10.18160/gcp-2022
- 2021 total anthropogenic CO₂ emission (including the cement carbonation sink) of 10.9 ± 0.8 GtC/year (40.0 ± 2.9 GtCO₂)
- for 2021, fossil emissions increased by 5.1 % relative to 2020 to 9.9 ± 0.5 GtC/year (including the cement carbonation sink, 0.2 GtC/year)
- 2021 global atmospheric CO₂ concentration: 414.71 ± 0.1 ppm
- remaining carbon budget for a 50 % likelihood to limit global warming to 1.5, 1.7, and 2°C has been reduced to 105 GtC (380 GtCO₂), 200 GtC (730 GtCO₂), and 335 GtC (1230 GtCO₂)
- new file with nationally resolved landuse change emissions


Published: March 21, 2022
Citation: Friedlingstein et al., Global Carbon Budget 2021. https://doi.org/10.5194/essd-14-1917-2022
Data: Global Carbon Project. (2021). Supplemental data of Global Carbon Budget 2021 (Version 1.0) [Data set]. Global Carbon Project. https://doi.org/10.18160/gcp-2021
- 2020 total anthropogenic CO₂ emissions: 10.2 ± 0.8 GtC/year (37.4 ± 2.9 GtCO₂/year)
- in 2020 fossil emissions declined by 5.4% relative to 2019 to 9.3 ± 0.5 GtC/year (including the cement carbonation sink, 0.2 GtC/year)
- 2020 global atmospheric CO₂ concentration: 412.45 ± 0.1 ppm
- compared to earlier estimates revised land-use change emissions show decrease in last decade

Published: December 11, 2020
Citation: Friedlingstein et al., Global Carbon Budget 2020. https://doi.org/10.5194/essd-12-3269-2020
Data: Global Carbon Project. (2020). Supplemental data of Global Carbon Budget 2020 (Version 1.0) [Data set]. Global Carbon Project. https://doi.org/10.18160/gcp-2020
- 2019 total anthropogenic CO₂ emissions: 11.5 ± 0.9 GtC/year (42.2 ± 3.3 GtCO₂/year).
- in 2019 fossil emissions increased by 0.1% to 9.7 ± 0.5 GtC/year (including the cement carbonation sink, 0.2 GtC/year)
- 2019 global atmospheric CO₂ concentration: 409.85 ± 0.1 ppm
- inclusion of cement carbonation sink in budget calculations

Published: December 4, 2019
Citation: Friedlingstein et al., Global Carbon Budget 2019. https://doi.org/10.5194/essd-11-1783-2019
Data: Global Carbon Project. (2019). Supplemental data of Global Carbon Budget 2019 (Version 1.0) [Data set]. Global Carbon Project. https://doi.org/10.18160/gcp-2019
- 2018 total anthropogenic CO₂ emissions: 11.5 ± 0.9 GtC/year (42.5 ± 3.3 GtCO₂/year)
- 2018 growth in fossil CO₂ emissions was about 2.1%, an increase to 10.0 ± 0.5 GtC/year
- 2018 global atmospheric CO₂ concentration: 407.38 ± 0.1 ppm

Published: December 5, 2018
Citation: Le Quéré et al., Global Carbon Budget 2018. https://doi.org/10.5194/essd-10-2141-2018
Data: Global Carbon Project. (2018). Supplemental data of Global Carbon Budget 2018 (Version 1.0) [Data set]. Global Carbon Project. https://doi.org/10.18160/gcp-2018
- 2017 growth in fossil CO₂ emissions was about 1.6%, an increase to 9.9 ± 0.5 GtC/year
- 2017 global atmospheric CO₂ concentration: 405.0 ± 0.1 ppm